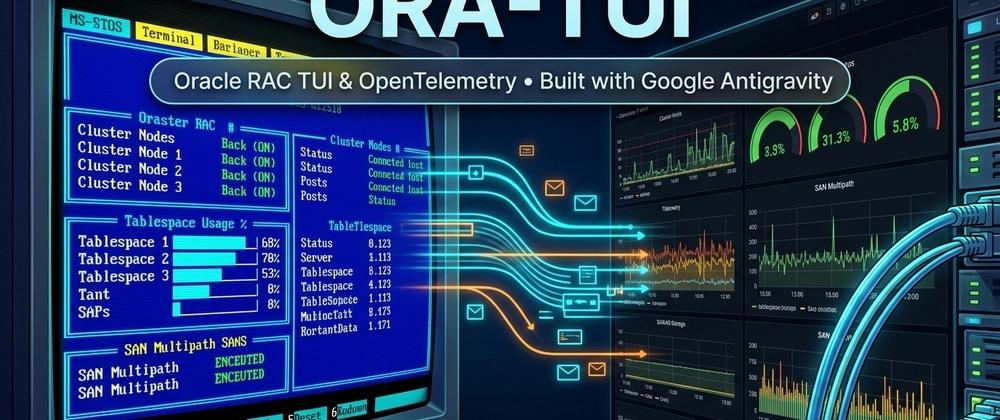
Managing enterprise Oracle RAC, Oracle Restart, and Single Instance databases over SSH often feels like juggling a dozen terminal tabs at 3:00 AM. You have sqlplus open in one window, crsctl status resource -t in another, lsnrctl status in a third, rman in a fourth, and multipath -ll or df -i in a fifth to figure out why a LUN path dropped or why ORA-09925: Unable to create audit trail file just locked out connections.
What if you had a single, zero-dependency binary that:
- Gives you a Norton Commander / Borland Turbo C++ / IBM Green Phosphor CRT interactive Terminal UI (
TUI) with full mouse support over SSH? - Audits not only Oracle Clusterware, PDBs, Tablespaces (
AUTOEXTEND), Blocking Locks, ASM, RMAN, and Alert Logs, but also Linux Kernel parameters, HugePages, Filesystem Inodes, Fibre Channel HBAs, and SAN Multipath (multipath -ll)? - Doubles as a headless OpenTelemetry (
OTLP JSON) & Prometheus (/metrics) Exporter on port9161, complete with a 1-command Docker POC (Prometheus + 15 Alert Rules + 26-Panel Grafana Dashboard)?
Meet ora-tui — and in this post, I’ll share how I built and evolved it from scratch to v1.6.0 using Google Antigravity powered by Gemini 4 Argon.
🤖 Built with Google Antigravity & Gemini 4 Argon
The entire lifecycle of ora-tui—from low-level Linux /proc and /sys/class/fc_host parsers to SQL*Plus pipe-delimited collectors, authentic 1990s VGA palettes, an embedded OpenTelemetry server, and automated RPM/DEB packaging—was built in Google Antigravity using Gemini 4 Argon.
What made the Antigravity + Gemini 4 Argon workflow stand out during this project:
-
Deep Domain Reasoning Across Oracle & Linux Internals: Gemini 4 Argon didn't just write boilerplate Go code. When we noticed tablespaces with
AUTOEXTEND ONwere showing misleading percentages, it immediately rewrote the SQL collector to compute real capacity againstMAXBYTES. When we tested against a real RHEL 8 Oracle 19c server, it distinguished dynamicREADYlistener services (registered via PMON/LREG) from staticUNKNOWNentries inlistener.ora, and tightened the Alert Log parser to match strict^ORA-lines while ignoring false positives from OPatch metadata. -
Visual Precision from Reference Screenshots: When I shared classic screenshots of Borland Turbo C++ 3.0 and Norton Commander 5.0, Gemini 4 Argon inspected the exact VGA hex colors (
#0000AFRoyal Blue,#00AFAFTeal,#5FFFFFBright Cyan,#FFFF5FBright Yellow,#A8A8A8Silver menu bar) and recreated the exact look and feel—including a 1980s IBM 5151 Green Phosphor CRT theme with 100% full-width hardware inverse-video selection bars. -
End-to-End Agentic Execution: Inside Antigravity, Gemini 4 Argon compiled cross-platform static binaries (
GOOS=linux GOARCH=amd64 CGO_ENABLED=0), ran unit tests on real SQL*Plus andmultipath -lloutputs, packaged.rpmand.debinstallers vianfpm, and built a complete auto-provisioned Prometheus + Grafana Docker POC.
🖥️ Preview: Retro MS-DOS Aesthetics Meet Oracle DBA Power
Here is what ora-tui looks like right in your terminal (ora-tui --preview):
╔══════════════════════════════════════════════════════════════════════════════════════════════════════════════════════╗
║                    ══ NORTON COMMANDER ORA-TUI v1.6.0 :: ORACLE CLUSTER, DB & SERVER MANAGER ══                      ║
╠══════════════════════════════════════════════════════════════════════════════════════════════════════════════════════╣
║ Modo: [ORACLE RAC] │ Host: ora-rac01.corp.local │ Cluster: crs-prod-cluster │ Ver: 19.24.0.0.0 │ Tema: NORTON        ║
║ HOME: /u01/app/oracle/product/19.0.0/dbhome_1 (oracle) │ 2 Inst OPEN │ 4 PDBs │ 4 Sesiones (1 Locks) │ 1 Errores ORA-║
╠═════════════════════════════╦════════════════════════════════════════════════════════════════════════════════════════╣
║ MENU [Flechas ↑↓ + Enter]   ║ PANTALLA ACTIVA: VISTA INTEGRAL + VENTANA EMERGENTE (Borde Simple ┌─┐ y Doble ╔═╗)     ║
╠═════════════════════════════╬════════════════════════════════════════════════════════════════════════════════════════╣
║ ▸ 1. Cluster & DB Estado    ║ ┌─ NODOS DEL CLUSTER & INSTANCIAS (ORACLE RAC / SINGLE) ─────────────────────────────┐ ║
║   2. Usuarios Conectados    ║ │ NODO       ESTADO   CRS     CSSD    ASM            INST      MODO        FRA_USO   │ ║
║   3. Tablespaces & Files    ║ │ ora-rac01  ONLINE   ONLINE  ONLINE  ONLINE(+ASM1)  PRODCDB1  READ WRITE  [████░░░░]│ ║
║   4. Tablas & Objetos       ║ │ ora-rac02  ONLINE   ONLINE  ONLINE  ONLINE(+ASM2)  PRODCDB2  READ WRITE  [████░░░░]│ ║
║   5. ASM & Red Listeners    ║ └────────────────────────────────────────────────────────────────────────────────────┘ ║
║   6. RMAN, Flashback & DG   ║ ┌─ USUARIOS CONECTADOS (gv$session) ───────────┬─ TABLESPACES & SAN MULTIPATH ───────┐ ║
║   7. Alert Log & Errores    ║ │ SID,SER#  USUARIO    ESTADO   EVENTO / LOCK  │ RECURSO       ESTADO / USO %        │ ║
║   8. Servidor, Discos & SAN ║ │ 142,48219 ERP_APP    ACTIVE   db file seq rd │ ERP_DATA_TBS  [█████████░] 93.0% !! │ ║
║   9. Centro Mantenimiento   ║ │ 289,11042 CRM_BATCH  ACTIVE   enq: TX lock   │ mpatha (ASM)  4/4 PATHS ACTIVE (OK) │ ║
║   c. Cambiar Tema Color     ║ │ 512,9931  CRM_ADMIN  INACT    BLOCKER (289)  │ mpathc (FRA)  3/4 DEGRADED (FAULTY) │ ║
║   b. Cambiar Marcos ┌─┐/╔═╗ ║ │ 604,33105 BI_REPORT  ACTIVE   ON CPU (512MB) │ /u01 Inodos   14.2% (Libre ORA-9925)│ ║
║   F1/h. Mostrar/Ocultar Ayu ║ └──────────────────────────────────────────────┴─────────────────────────────────────┘ ║
║   t. Cambiar Topologia      ║                                                                                        ║
║   q. Salir (Quit)           ║      ╔══════════════════════════════════════════════════════════════════════════╗      ║
║                             ║      ║      ══ VENTANA DE MANTENIMIENTO [Seleccione con Flechas ↑↓ + Enter] ══  ║      ║
║                             ║      ╠══════════════════════════════════════════════════════════════════════════╣      ║
║                             ║      ║ ▸ [1] Drenar / Aislar Nodo Cluster (Relocate Services + Stop CRS)        ║      ║
║                             ║      ║   [2] Parar / Arrancar Instancia o Base de Datos (srvctl / sqlplus)      ║      ║
║                             ║      ║   [3] Ampliar Tablespace Crítico (+Datafile 32G a ERP_DATA_TBS 93%)      ║      ║
║                             ║      ║   [4] Matar Sesión Bloqueante (KILL SESSION '512,9931,@2' IMMEDIATE)     ║      ║
║                             ║      ║   [5] Auditoría Completa SAN Multipath (multipath -ll) & HBA FC          ║      ║
║                             ║      ║   [Esc] Cancelar / Cerrar Ventana                                        ║      ║
║                             ║      ╚══════════════════════════════════════════════════════════════════════════╝      ║
╠═════════════════════════════╩════════════════════════════════════════════════════════════════════════════════════════╣
║ ┌─ C:\ORACLE> CONSOLA MS-DOS & AUDITORIA EN VIVO ──────────────────────────────────────────────────────────────────┐ ║
║ │ C:\> [08:05:01] Auto-Discovery: Modo=ORACLE RAC │ Cluster=crs-prod-cluster │ Release=19.24.0.0.0                 │ ║
║ │ C:\> [08:05:02] ALERTA SAN: mpathc presenta 1 camino caído (3/4 DEGRADED) │ Tablespace ERP_DATA_TBS al 93.0%     │ ║
║ └──────────────────────────────────────────────────────────────────────────────────────────────────────────────────┘ ║
╚══════════════════════════════════════════════════════════════════════════════════════════════════════════════════════╝
4 Live-Switchable Retro Color Themes (c key)
Pressing c at any time cycles through four themes on the fly:
-
Norton Commander 5.0: Classic
#0000AFRoyal Blue panels,#5FFFFFBright Cyan borders,#FFFF5FBright Yellow column headers,#00AFAFTeal cursor bar, and a black MS-DOSC:\ORACLE>bottom console. -
Borland Turbo C++ 3.0: Silver (
#A8A8A8) top menu bar with the red[≡]system icon, Royal Blue editor window with double white frames, green active selection bar, and the classic Teal (#00AFAF)Project:bottom window. -
IBM 5151 Green Phosphor CRT: Deep
#001000phosphor background with glowing#00FF5Ftext and 100% full-row hardware inverse video on selected items. - Modern Dark Terminal: High-contrast dark theme.
⚙️ Zero-Config Architecture & CGO_ENABLED=0
One of the biggest pain points of deploying Go tools on Oracle Linux / RHEL database servers is C library dependencies (glibc mismatches or missing libclntsh.so Instant Client libraries).
ora-tui is compiled with CGO_ENABLED=0:
-
Automatic Topology Discovery: On startup, it inspects
/etc/oracle/ocr.loc,/etc/oracle/olr.loc,/etc/oratab,inventory.xml, and/proc/[0-9]*/cmdline(ora_pmon_*,db_pmon_*,asm_pmon_*) to detect whether the host is Oracle RAC, Oracle Restart, or Single Instance (from 11gR2 up to 23ai). -
Dynamic UNIX Privilege Switching: In production, Grid Infrastructure belongs to
grid, RDBMS binaries belong tooracle, and clusterware stack commands requireroot.ora-tuiinspects directory ownership viaos.Statand dynamically switches UID/GID (syscall.Credential/sudo -n -u) forsqlplus,srvctl,lsnrctl,rman, andadrci, reservingrootstrictly forcrsctlor SCSI bus rescans. -
Scrollable Popup Operation Output Window: Every diagnostic or maintenance action opens a centered, scrollable popup window (
↑/↓/PgUp/PgDn) displaying the complete multi-line command output in real time.
🔍 The 9 Interactive Modules (Including Linux & SAN Multipath Auditing)
-
Cluster & DB Status: Nodes (
olsnodes), Daemons (CRS,CSSD,EVMD,ASM), Instances (gv$instance), PDBs (gv$pdbs), RAC Services, and a 4-step Graceful Node Drain wizard. -
Connected Users (
gv$session): Active/inactive sessions, wait events,SQL_ID, PGA memory usage, TX/TM blocking lock chains,KILL SESSION IMMEDIATE, and liveDBMS_XPLANexecution plans. -
Tablespaces & Datafiles: Real usage percentages accounting for
AUTOEXTEND MAXBYTES, visual progress bars, and 1-click datafile addition. -
Table Segments & Invalid Objects: Top segments by size/rows,
FRESH/STALEoptimizer statistics, online table shrink (SHRINK SPACE CASCADE), index rebuilds, andUTL_RECOMPinvalid object compilation. -
ASM & Network Listeners: ASM diskgroups (
USABLE_FILE_MB,OFFLINE_DISKS) and local/SCAN listeners distinguishingREADY(dynamic PMON/LREG) fromUNKNOWN(listener.orastatic) handlers. -
RMAN, Flashback & Data Guard: RMAN backup job history, Guaranteed Restore Points (GRP), and Data Guard Standby
MRP0+ Transport/Apply Lag monitoring. -
Alert Log & Strict
ORA-Errors: Real-timealert_<SID>.logparser and ADRCI trace purge workflows. -
Linux Server, Disks & SAN Multipath (
Module 8):-
CPU, Memory & Kernel: Load Average (
1m/5m/15m) vs CPU cores, Physical RAM, Swap &vm.swappiness, StaticHugePages (2MB), verification thatTransparent HugePages = [never], Kernel Async I/O slots (fs.aio-nr/fs.aio-max-nr), and File Descriptors (fs.file-nr). -
Filesystems & Inodes (
df -PTm&df -Pi): Space and Inode usage % across/u01,/,/var,/tmpto prevent dreadedORA-09925lockouts caused by millions of.aud/.trcfiles. -
SAN Multipath (
multipath -ll) & Fibre Channel HBAs: Verifies that all physical SAN paths for every LUN are active (4/4 ACTIVE) and immediately flags degraded LUNs (3/4 DEGRADED - FAULTY), checks/sys/class/fc_host/host*HBA speed/state (16G/32GOnline), and provides live SCSI/Multipath rescanning.
-
CPU, Memory & Kernel: Load Average (
- Maintenance Center: Guided step-by-step DBA and sysadmin wizards.
📈 Embedded OpenTelemetry & Prometheus Exporter (--opentelemetry) + 1-Command Docker POC
Want 24/7 historical graphs and alerting without installing heavy Java agents? Start ora-tui with --opentelemetry (or run it as a background systemd service via ora-tui-otel.service):
# Run in headless daemon mode on port 9161 (conflict-free with Oracle ports):
sudo ora-tui --opentelemetry --daemon --otel-port=9161

# Or enable the bundled systemd service:
sudo systemctl enable --now ora-tui-otel
It exposes 52 metrics across:
-
http://<oracle-host>:9161/metrics— Prometheus / OpenMetrics format -
http://<oracle-host>:9161/otel/v1/metrics— OpenTelemetry OTLP/HTTP JSON (resourceMetrics) -
http://<oracle-host>:9161/api/v1/state— Full JSON State Snapshot
Spinning up the Ready-to-Run POC/ Folder on Any Docker Host
Inside the repository (and packaged under /usr/share/ora-tui/POC/), we included a self-contained POC/ folder with an interactive setup script (./configure-poc.sh).
Every time you run ./configure-poc.sh on your Docker server, it prompts for the Oracle hostname or IP you want to monitor, configures Prometheus with 15 Oracle & SAN alert rules, checks connectivity, and launches Grafana with a 26-panel Full Observability Dashboard automatically loaded as the Home screen:
git clone https://github.com/mario-ezquerro/oratui.git
cd oratui/POC
chmod +x configure-poc.sh
./configure-poc.sh
==========================================================================
  CONFIGURACIÓN DE LA POC ORA-TUI (PROMETHEUS + GRAFANA)
==========================================================================

👉 Introduce el nombre o IP del host Oracle a monitorizar [servidor-oracle.local]: 192.168.1.50
👉 Introduce el puerto OpenTelemetry de ora-tui [9161]: 9161

>>> Generando configuración de Prometheus para monitorizar: 192.168.1.50:9161 ...
>>> Verificando conexión con http://192.168.1.50:9161/healthz ...
    [OK] Conexión exitosa con ora-tui en 192.168.1.50:9161.
>>> Levantando / recargando contenedores Docker (Prometheus + Grafana)...
Open http://<docker-host>:3000 (admin / admin) and all 26 panels—covering Clusterware, Instances, FRA %, PDBs, Tablespaces, ASM Diskgroups, Active/Blocking Sessions, PGA Memory, RMAN Backups, Data Guard Lag, ORA- Alert Log errors, Linux Load/RAM/HugePages, Filesystem Inodes, and SAN Multipath health—are live out of the box!
🚀 Try It Yourself (dnf, rpm, apt-get, or --mock Mode)
You can install the prebuilt .rpm or .deb directly from GitHub, or test it on macOS/Linux without an Oracle database using --mock:
# RHEL / Oracle Linux 8 & 9:
sudo dnf install -y https://github.com/mario-ezquerro/oratui/raw/main/dist/ora-tui-1.6.0-1.x86_64.rpm

# Debian / Ubuntu:
curl -fL -o /tmp/ora-tui.deb https://github.com/mario-ezquerro/oratui/raw/main/dist/ora-tui_1.6.0-1_amd64.deb
sudo apt-get install -y /tmp/ora-tui.deb

# Or run the interactive simulator anywhere from source:
git clone https://github.com/mario-ezquerro/oratui.git
cd oratui
make mock
🔗 GitHub Repository: https://github.com/mario-ezquerro/oratui
Have questions or ideas for new Oracle / SAN checks? Drop a comment below or open an issue on GitHub!