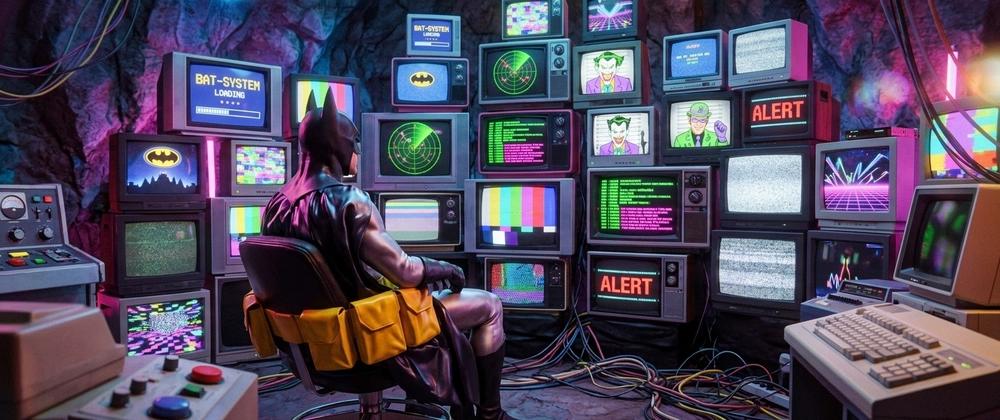
In my last post, I wrote about moving Forem’s performance and maintenance work into autonomous loops on top of OpenHands. Over a month, those loops shipped 351 pull requests, cut average Rails request time from 70ms to 16ms, and got me out of the business of being a human clipboard between dashboards and terminals.
Stepping out of the day-to-day execution loop immediately creates a different problem: once the factory is running on its own, how do you actually see it?
Text-driven interfaces will always be powerful. The terminal, the prompt box, and the markdown log are native to how language models work and how developers express ad-hoc intent. None of that is going away.
What is strange is how uncreative almost all of the UI surrounding AI tools is right now. We have the most capable software-generating engines in history, and our nearly universal interface for operating them is a dark-mode chat window with a blinking cursor and a scrolling wall of JSON tool calls.
A chat box is a fine place to have a conversation. It is a terrible instrument panel, and every platform looks the exact same.
Scrollback is not observability
With a single interactive session, you can hold the state of the world in your head. You know the branch, the model, and why a test failed because you watched the text stream by.
The moment you move to eight autonomous loops firing every ten minutes across isolated git worktrees, three frontier model subscriptions, and dozens of in-flight pull requests, chat scrollback breaks down. Answering basic operational questions from a list of chat transcripts turns you right back into a meat router:
- Did the Rust loop stop opening PRs because it ran out of candidates, because its
WIP <= 1gate is full, or because a stale.gitconfig.lockwedged the worktree? - Did Claude Opus 5.5 just hit a rate-limit cooldown, and did the router cleanly hand the next tick to Gemini 4 Argon or GPT-6.1 Sol?
- Is PR
#24547healing itself on its 10-minute CI check-in, or has it burned three repair rounds on the same failing spec?
If you have to click into five conversation logs or run four CLI commands to reconstruct that picture, the interface is failing you. Good observability isn’t about having all the logs somewhere. It’s about shaping the data so you can make a clear decision in five seconds.
Using the tools to build the instrument panel
The irony of bland AI interfaces is that the very tools we are staring at make it trivial to build better ones.
I have no illusion that a dashboard I spin up in an afternoon will rival what the best dedicated AI observability products should look like a year or two from now. We are still in the early days of figuring out the visual grammar for managing autonomous software, and dedicated platforms will eventually nail this.
Until they do, you don’t have to settle for the generic default. A bespoke interface built around your system’s exact levers will beat a one-size-fits-all chat shell every time, and AI coding tools let you iterate on that interface as fast as the underlying system evolves.
In an effort to do more than just complain, I prioritized building a custom control center right alongside the loops themselves.
The Automation Observatory

I ditched the default OpenHands theme and home page for a custom observability platform. I consider this the least I can do, but part of the maintenance itself is improvements in the tooling over time, so this is a work in progress which I hope will yield some creative results. Packaged as a Schema v1 Canvas extension, it survives upstream upgrades without forking the core app.
Every section maps to a concrete decision I needed to make while tuning the factory:
1. The Autonomous Loop Registry. Instead of recent chats, the centerpiece is an Airtable-style ledger table showing all nine workflows (perf-loop, rust-loop, error-loop, test-loop, deps-loop, issue-loop, github-pr-reviewer, pr-merge-loop, and worktree-pruner). Each row shows live status, cadence, WIP cap, and open PRs, with inline controls to pause, trigger a run, or pin a specific model provider.
2. Frontier Subscription Balance and Cooldowns. A three-column sheet tracks our model router across Gemini 4 Argon (agy-acp), Claude Opus 5.5 (claude-acp), and GPT-6.1 Sol (codex-acp), showing run distribution, whether any provider is in an 8-hour cooldown, and a one-click reset when credentials refresh.
3. The Open PR Check-In Radar. Every autonomous PR is watched on a 5 -> 10 -> 20 -> 40 minute exponential back-off schedule for CI failures or review comments. The radar lists every open PR in that queue, its current back-off step, repair rounds attempted, and a live countdown to its next check-in.
4. Ephemeral Worktree Hygiene. A bottom ledger tracks the count and age of isolated /data/worktrees/* checkouts, read-only Postgres health, and Mac bridge status. When parallel git gc runs left orphaned directories behind, it showed up here immediately as worktree ages creeping past an hour.
Designing for human judgment
None of this replaces text. When I want to explore a feed-ranking idea or pair on a four-phase JavaScript asset cleanup, I still click "New Chat" or open a terminal.
But separating conversation from supervision changed how the whole system feels to run. A good interface compresses operational noise into peripheral vision. I can glance at the Almanac over coffee, see that eight loops are green, notice that rust-loop is pinned to Argon with one PR in review, and close the tab.
We are barely scratching the surface of what human interfaces for agentic systems should look like. For now, the best part of having agents that write code is that you don’t have to wait around for someone else to design the cockpit.